Creating graphs for scripted 16-port switch

Post general support questions here that do not specifically fall into the Linux or Windows categories.

Moderators: Developers, Moderators

Post Reply
desertflora
Posts: 4
Joined: Fri May 03, 2024 1:08 am

Creating graphs for scripted 16-port switch

Post by desertflora »

I have a TP-Link SG1016PE switch that doesn't support SNMP, and created the following Python script to extract port statistics:

Code: Select all

import requests
ip = '192.168.0.1'

url = f'http://{ip}/logon.cgi'
data = {'username':'admin', 'password':'....', 'cpassword': '', 'logon':'Login'}
response = requests.post(url, data=data)

url = f'http://{ip}/PortStatisticsRpm.htm'
response = requests.get(url)

lines = response.text.split("\n")

pkts = [l for l in lines if l.startswith('pkts')][0]
pkts = pkts[6:-1].split(',')

for port in range(16):
    print(f'port{port+1}_tx:{pkts[4*port+0]} ', end='')
    print(f'port{port+1}_rx:{pkts[4*port+2]}', end='')
    if(port<16): print(' ', end='')
This is an example of the output of the script:
port1_tx:5349846 port1_rx:3867312 port2_tx:2750447 port2_rx:1481102 port3_tx:6133576 port3_rx:3378887 port4_tx:4210717 port4_rx:1407855 port5_tx:1592126 port5_rx:750650 port6_tx:0 port6_rx:0 port7_tx:0 port7_rx:0 port8_tx:0 port8_rx:0 port9_tx:830444 port9_rx:182541 port10_tx:806663 port10_rx:8044 port11_tx:6102219 port11_rx:5181009 port12_tx:12247623 port12_rx:18245205 port13_tx:0 port13_rx:0 port14_tx:0 port14_rx:0 port15_tx:0 port15_rx:0 port16_tx:0 port16_rx:0
Under Data Input Methods I have created a new tplink1016pe method with script "/usr/bin/python3 /path/to/tplink_sg1016pe.py", and 32 output fields (port1_rx, port1_tx, etc).

Under Data Source Templates I have created a data template based on the data input method tplink1016pe, with 32 data source items (port1_rx, port1_tx, etc, type DERIVE).

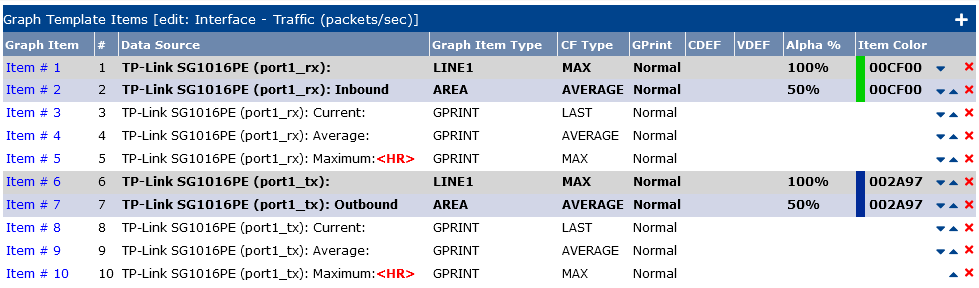
I'm stuck what the next step should be to get one graph for each port. Under Template, Graph, I have to create one graph template per port. That is an insane amount of clicking if I want 10 items on each graph:
Image

Is the solution to run the script once for each switch port, so the output fields are constant? Or is there another elegant solution?
macan
Cacti Pro User
Posts: 898
Joined: Tue Mar 18, 2008 2:30 am
Location: Czech

Re: Creating graphs for scripted 16-port switch

Post by macan »

Let the Cacti grow!
desertflora
Posts: 4
Joined: Fri May 03, 2024 1:08 am

Re: Creating graphs for scripted 16-port switch

Post by desertflora »

Thank you. I started with https://files.cacti.net/docs/html/makin ... cacti.html and it went downhill from there. With the instructions on the page you linked it was considerably less clicking. Here are my script and xml for folks with the same switch:

Code: Select all

import sys
import pickle
import os
import time

ip = sys.argv[1]
cmd = sys.argv[2]
delimiter = '!'
num_ports = 16

def get_packet_stats(ip):
    cache_file = f'/tmp/tplink_cache_{ip.replace(".", "_")}.pickle'
    if os.path.exists(cache_file) and os.path.getmtime(cache_file) > time.time() - 60:
        pkts = pickle.load(open(cache_file, 'rb'))
        return pkts

    import requests
    url = f'http://{ip}/logon.cgi'
    data = {'username':'admin', 'password':'....', 'cpassword': '', 'logon':'Login'}
    response = requests.post(url, data=data)

    url = f'http://{ip}/PortStatisticsRpm.htm'
    response = requests.get(url)

    lines = response.text.split("\n")

    pkts = [l for l in lines if l.startswith('pkts')][0]
    pkts = pkts[6:-1].split(',')
    pickle.dump(pkts, open(cache_file, 'wb'))
    return pkts

if cmd == 'index':
    print("\n".join(map(str, range(1, num_ports+1))))
    
if cmd == 'query':
    query_field = sys.argv[3]
    if query_field in ['tx', 'rx']:
        pkts = get_packet_stats(ip)
    
    for port in range(num_ports):
        if query_field == 'tx':
            print(f'{port+1}{delimiter}{pkts[4*port+0]}')
        if query_field == 'rx':
            print(f'{port+1}{delimiter}{pkts[4*port+2]}')
        if query_field == 'index':
            print(f'{port+1}{delimiter}{port+1}')
        if query_field == 'ifdescription':
            print(f'{port+1}{delimiter}Port {port+1}')
     
if cmd == 'get':
    query_field = sys.argv[3]
    query_index = int(sys.argv[4])
    port = query_index - 1
    if query_field in ['tx', 'rx']:
        pkts = get_packet_stats(ip)

    if query_field == 'tx':
        print(pkts[4*port+0])
    if query_field == 'rx':
        pkts = get_packet_stats(ip)
        print(pkts[4*port+2])
    if query_field == 'index':
        print(port+1)
    if query_field == 'ifdescription':
        print(f'Port {port+1}')

Code: Select all

<interface>
        <name>Get Interface Traffic Information</name>
        <script_path>/usr/bin/python3 |path_cacti|/scripts/tplink_sg1016pe.py</script_path>
        <arg_prepend>|host_hostname|</arg_prepend>
        <arg_index>index</arg_index>
        <arg_query>query</arg_query>
        <arg_get>get</arg_get>
        <output_delimiter>!</output_delimiter>
        <index_order>ifIndex</index_order>
        <index_order_type>numeric</index_order_type>
        <index_title_format>|chosen_order_field|</index_title_format>
        <fields>
                <ifIndex>
                        <name>Index</name>
                        <direction>input</direction>
                        <query_name>index</query_name>
                </ifIndex>
                <ifDescription>
                        <name>Description</name>
                        <direction>input</direction>
                        <query_name>ifdescription</query_name>
                </ifDescription>
                <ifTxPackets>
                        <name>TX Packets</name>
                        <direction>output</direction>
                        <query_name>tx</query_name>
                </ifTxPackets>

                <ifRxPackets>
                        <name>RX Packets</name>
                        <direction>output</direction>
                        <query_name>rx</query_name>
                </ifRxPackets>
        </fields>
</interface>
Last edited by desertflora on Sun May 05, 2024 12:42 am, edited 1 time in total.
desertflora
Posts: 4
Joined: Fri May 03, 2024 1:08 am

Re: Creating graphs for scripted 16-port switch

Post by desertflora »

The Cacti poller uses "get" instead of "query", so for this 16 port switch it runs the script 32 times instead of twice. Would it be possible to make it use query?
User avatar
TheWitness
Developer
Posts: 16897
Joined: Tue May 14, 2002 5:08 pm
Location: MI, USA
Contact:

Re: Creating graphs for scripted 16-port switch

Post by TheWitness »

For implementations like this, I generally write a plugin that creates a local data-cache and then the Cacti data collector simply pulls from the local data-cache instead of polling the data every poller cycle. The plugins MikroTik, and HMIB are two real good examples of how I done this. I pull the data out of band and then just graph from the out of band data. I've written other not so public examples like IBM's Spectrum LSF RTM server, where we do it on steroids. In that series of plugins and data collectors, we store quite a bit of meta-data and live job information from the LSF Cluster and then graph from it's rich data-cache.

In Spectrum LSF RTM, we can graph easily 50-100k hosts and all the data associated with LSF Clusters at a 5 minute granularity.

You could write that plugin in any language, it does not need to be in PHP, the important point is that your data-cache is maintained, and that you at least sample the 'Availability/Reachability' using ICMP|TCP|UDP|SNMP Ping so you can track availability.

Best of luck to you.
True understanding begins only when we realize how little we truly understand...

Life is an adventure, let yours begin with Cacti!

Author of dozens of Cacti plugins and customization's. Advocate of LAMP, MariaDB, IBM Spectrum LSF and the world of batch. Creator of IBM Spectrum RTM, author of quite a bit of unpublished work and most of Cacti's bugs.
_________________
Official Cacti Documentation
GitHub Repository with Supported Plugins
Percona Device Packages (no support)
Interesting Device Packages


For those wondering, I'm still here, but lost in the shadows. Yearning for less bugs. Who want's a Cacti 1.3/2.0? Streams anyone?
desertflora
Posts: 4
Joined: Fri May 03, 2024 1:08 am

Re: Creating graphs for scripted 16-port switch

Post by desertflora »

Thank you. I have added a basic cache to the script posted earlier (which works well if the poller is single threaded). The script uses a file for caching while he plugins MikroTik, and HMIB use MySQL, and doesn't store Availability/Reachability. I also moved the "import requests" down for performance, so the library is only loaded when necessary. My earlier post has been updated to reflect these changes.

Still, each cached execution takes 0.1 seconds on my hardware. That's 3.2 seconds for one 16-port switch. A simple print("hello world") script without any includes already takes 0.07 seconds with Python or PHP so there is little room to optimize. At this point I'm wondering why I implemented the query method if Cacti doesn't use it. It would improve performance 16 fold.
User avatar
TheWitness
Developer
Posts: 16897
Joined: Tue May 14, 2002 5:08 pm
Location: MI, USA
Contact:

Re: Creating graphs for scripted 16-port switch

Post by TheWitness »

You have to implement a custom data input method/script to use it. There are some examples included with the default install. The are called Script Queries.
True understanding begins only when we realize how little we truly understand...

Life is an adventure, let yours begin with Cacti!

Author of dozens of Cacti plugins and customization's. Advocate of LAMP, MariaDB, IBM Spectrum LSF and the world of batch. Creator of IBM Spectrum RTM, author of quite a bit of unpublished work and most of Cacti's bugs.
_________________
Official Cacti Documentation
GitHub Repository with Supported Plugins
Percona Device Packages (no support)
Interesting Device Packages


For those wondering, I'm still here, but lost in the shadows. Yearning for less bugs. Who want's a Cacti 1.3/2.0? Streams anyone?
Post Reply

Who is online

Users browsing this forum: No registered users and 0 guests